Understanding Coverage Maps: Use Data to Choose the Best Internet Connection

Understanding Coverage Maps: Use Data to Choose the Best Internet Connection
When choosing an internet provider, it’s not just about price and advertised speed — coverage matters just as much. A fast plan on paper won’t help if the signal is weak, unstable, or doesn’t reach your home. That’s where coverage maps come in. They give you a data-driven view of how different providers perform in your specific area. In this article, you’ll learn what coverage maps are, how to read them, and how to use them to find the best internet connection for your needs.
What Is a Coverage Map?
A coverage map is a digital map that shows how well a network covers a geographic area. You can find maps for fiber, cable (coax), DSL, and mobile broadband (4G/5G). These maps are created by internet service providers (ISPs) and by government agencies such as the Federal Communications Commission (FCC), which collects and publishes broadband data across the United States.
Coverage maps typically use color codes to indicate signal strength or service availability. For example, green might mean “strong coverage,” while yellow or red indicates weaker or no service. By entering your address, you can get a fairly accurate idea of which technologies and providers work best where you live.
Læs også:



Understanding the Different Technologies
Before diving into the maps, it helps to understand the main types of internet connections available in the U.S.:
- Fiber – The fastest and most reliable option, offering equal upload and download speeds. However, it’s only available where fiber cables have been installed.
- Cable (coax) – Delivers high speeds through the same network used for cable TV. Performance can vary during peak hours since bandwidth is shared among users in your area.
- DSL (copper) – Uses telephone lines and tends to be slower, especially if you live far from the provider’s central office.
- Mobile broadband (4G/5G) – Wireless and flexible, but performance depends on signal strength and network congestion.
Coverage maps show where each technology is available and what kind of performance you can expect.
How to Read Coverage Maps
When you visit a coverage map — for example, on the FCC’s National Broadband Map or a provider’s website — follow these steps:
- Enter your address – This gives you a local view of available services.
- Select the technology – Compare fiber, cable, DSL, and 5G options.
- Check the color codes – Green usually means strong coverage; red or gray indicates limited or no service.
- Compare providers – Many maps let you view multiple ISPs, such as AT&T, Comcast Xfinity, Verizon, Spectrum, or T-Mobile.
- Review the details – Some maps include expected speeds, latency, and reliability data.
A good tip is to combine coverage map data with user reviews or speed test results from your neighborhood. This gives you a more realistic picture of how each service performs in everyday use.
Using Data to Make an Informed Choice
Coverage maps aren’t just for tech enthusiasts — they’re a practical tool for anyone who wants to get the most out of their internet connection. By relying on data instead of marketing claims, you can avoid costly mistakes and frustration.
- Live in a city? Fiber or cable is often the best choice.
- In a rural area? Check 5G or fixed wireless coverage — these can be strong alternatives if fiber isn’t available.
- Not sure which to choose? Compare multiple providers and see who offers the best combination of coverage, speed, and price.
Keep in mind that coverage can change over time as providers expand their networks. It’s worth checking the maps again if you move or consider switching plans.
When the Map Doesn’t Tell the Whole Story
Even though coverage maps are based on extensive data, they’re still models — not guarantees. Local factors like building materials, terrain, and router placement can affect your actual signal. That’s why it’s a good idea to test your connection in practice, for example with a trial period or a mobile hotspot you can move around your home.
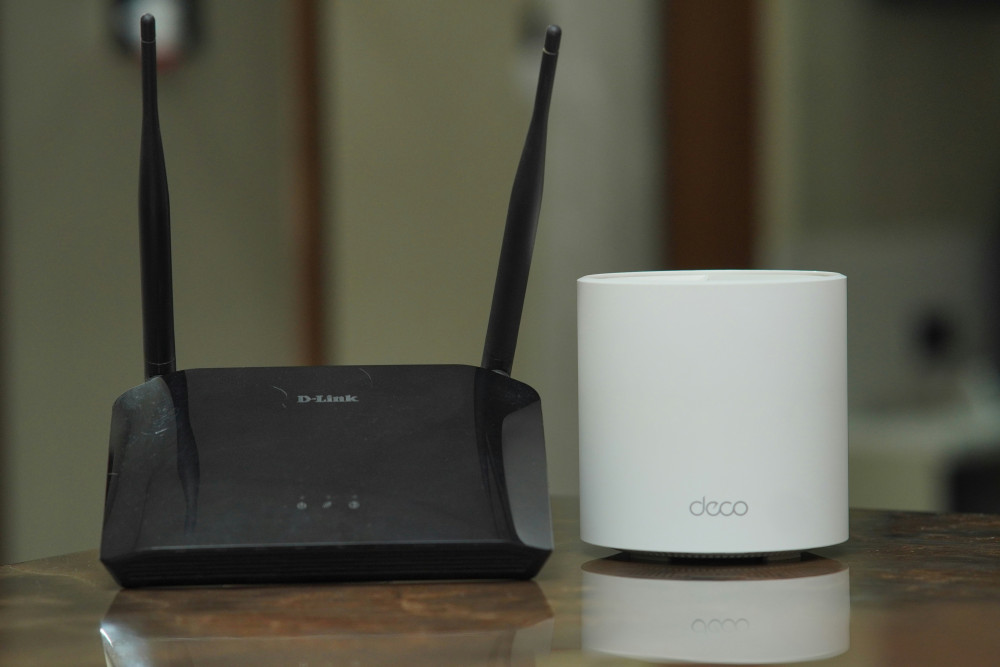
If you experience weak coverage, you can often improve it with an external antenna, a Wi-Fi extender, or by placing your router closer to a window or central location.
Making a Smarter Choice with Facts in Hand
Choosing an internet provider today is as much about understanding data as it is about comparing prices. Coverage maps give you a solid foundation for finding the connection that best fits your home and lifestyle. By using them actively, you’ll not only get faster internet — you’ll also gain peace of mind knowing your decision is based on facts, not guesswork.
Læs også: